


Discover how teams accelerate AI agent development by turning production failures into structured evaluation and improvement loops. Using Weights & Biases Weave and Models, this demo shows how failures become datasets, datasets become evaluators, and evaluators improve agent performance over time.
1
00:00:02,050 --> 00:00:13,759
Hey everyone, hi, Nico here. I'm going to demo the Mailbox Research Agent use case. Imagine thousands of people using a mailbox research agent that you developed.
2
00:00:14,140 --> 00:00:21,919
You select your company email and can ask any question about it.
3
00:00:21,920 --> 00:00:39,209
You can ask questions, it searches emails, reads them, and returns answers. Many users might be doing this at scale.
4
00:00:39,700 --> 00:00:53,940
Requests go through multiple agent steps. But when many people use it, things can go wrong, and it’s often hard to know what happened.
5
00:00:54,420 --> 00:00:57,720
Let’s look at this scenario with alerts enabled.
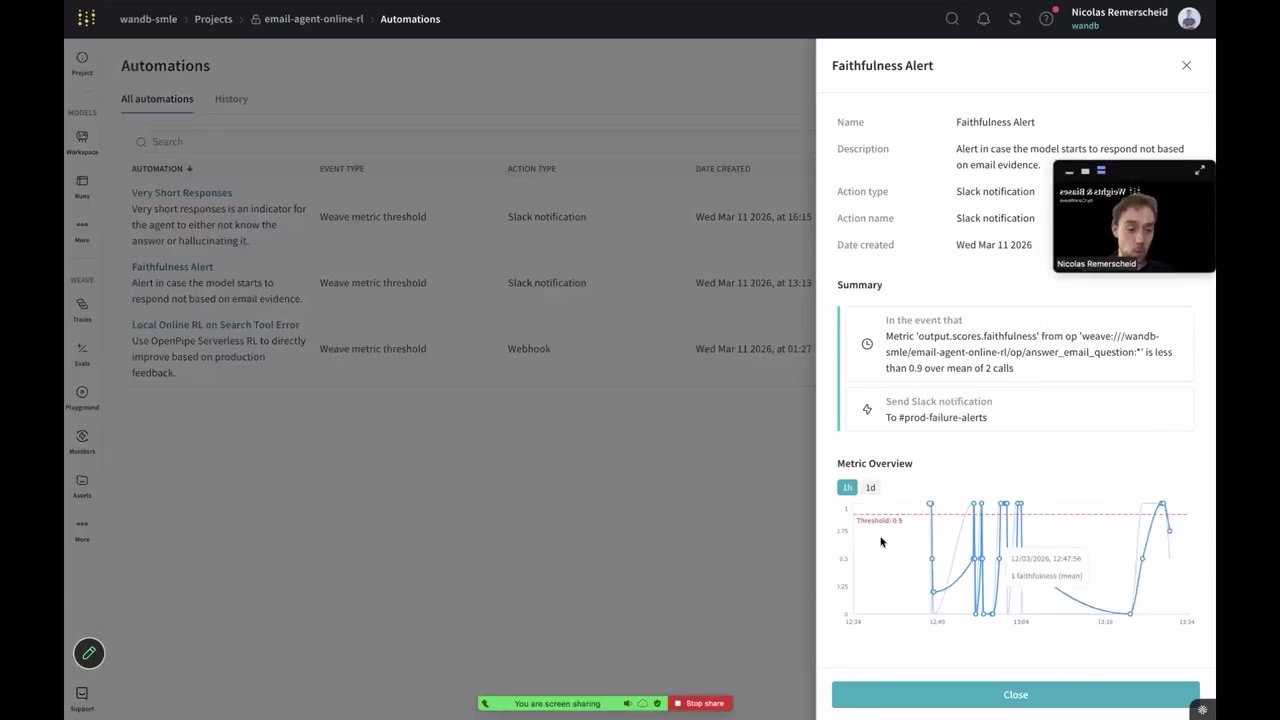
6
00:00:57,760 --> 00:01:09,959
We received alerts: a faithfulness alert and a short response alert.
7
00:01:09,970 --> 00:01:23,760
This means the answer wasn’t grounded in emails and was unusually short—often a sign of hallucination or failure.
8
00:01:23,960 --> 00:01:42,320
After multiple turns, the agent stopped searching emails and instead followed the conversation, producing hallucinated responses.
9
00:01:42,320 --> 00:01:55,339
This is hard to detect at scale when you have millions of traces.
10
00:01:55,530 --> 00:02:07,930
Typically, you'd start with dashboards showing traces, latency, tokens, and cost.
11
00:02:07,930 --> 00:02:17,549
But those metrics don’t explain agent behavior.
12
00:02:17,550 --> 00:02:21,180
System metrics alone are not enough.
13
00:02:21,180 --> 00:02:24,329
The next option is to inspect traces.
14
00:02:24,570 --> 00:02:26,620
Inside Weave, you can view traces.
15
00:02:26,840 --> 00:02:50,740
You can explore user questions and see step-by-step actions like searching inboxes and reading emails.
16
00:02:50,890 --> 00:02:59,170
This is useful but doesn’t scale across millions of traces.
17
00:02:59,270 --> 00:03:05,120
That’s where monitors and alerts come in.
18
00:03:05,390 --> 00:03:10,439
You can define monitors that score all incoming traces.
19
00:03:10,440 --> 00:03:26,849
For example, checking if answers are supported by email evidence using CoreWeave compute.
20
00:03:26,910 --> 00:03:46,060
Signals automatically score traces using custom metrics to evaluate agent behavior.
21
00:03:46,060 --> 00:03:51,799
You define a monitor, and all traces are scored in production.
22
00:03:52,120 --> 00:04:00,100
Next, you can trigger alerts when something goes wrong.
23
00:04:00,150 --> 00:04:11,479
Alerts show trends like how grounded your agent responses are over time.
24
00:04:11,480 --> 00:04:25,900
You can see performance degrade and identify when alerts were triggered.
25
00:04:25,900 --> 00:04:33,600
Slack alerts are helpful, but we can go further.
26
00:04:33,660 --> 00:04:44,170
You can trigger webhooks instead of alerts.
27
00:04:44,230 --> 00:05:07,749
These webhooks send failures to a reinforcement learning service for automated improvement.
28
00:05:08,280 --> 00:05:21,160
Failures are collected, rollouts are run, and the model is updated.
29
00:05:21,180 --> 00:05:36,960
This improves the model over time based on real production failures.
30
00:05:37,230 --> 00:06:00,129
This represents an ideal loop: automatic scoring, failure detection, and model improvement.
31
00:06:00,130 --> 00:06:18,259
More commonly, teams manually analyze traces and failures.
32
00:06:18,450 --> 00:06:33,260
You can filter traces, identify failures, and decide next steps.
33
00:06:33,260 --> 00:06:41,960
For example, adding failures to datasets or annotation queues.
34
00:06:42,310 --> 00:06:48,369
Domain experts can review and annotate failures.
35
00:06:48,370 --> 00:07:05,520
You can then run evaluations or re-score data.
36
00:07:05,760 --> 00:07:18,369
Evaluation dashboards show performance improvements over time.
37
00:07:18,700 --> 00:07:33,430
You can compare runs side-by-side to optimize your agent.
38
00:07:33,430 --> 00:07:49,869
This creates a loop from production failures to research improvements.
39
00:07:49,870 --> 00:07:56,590
Ultimately leading to better models and fewer failures.
40
00:07:56,950 --> 00:07:58,890
That’s the overview.
41
00:07:59,290 --> 00:08:05,800
If you have questions, feel free to reach out. Happy tracing!
42
00:08:08,430 --> 00:08:09,590
Alrighty.
