


See how teams deploy and run large-scale AI training with CoreWeave SUNK (Slurm on Kubernetes), combining Kubernetes scale with Slurm scheduling. This demo highlights self-service cluster deployment, integrated experiment tracking with Weights & Biases, and deep visibility into performance issues like GPU stragglers—helping teams optimize runs and reduce wasted compute.
1
00:00:06,580 --> 00:00:07,350
Hi.
2
00:00:07,590 --> 00:00:21,520
My name is Deok Filho. I'm a Senior Product Manager for AI Services at CoreWeave,
and I'll be covering a demo about training at scale with confidence using Slurm on Kubernetes,
CoreWeave's proprietary product called Sunk.
3
00:00:22,730 --> 00:00:30,230
Across the CoreWeave stack, many different elements come together
to provide customers with a unique training experience.
4
00:00:30,630 --> 00:00:33,330
Sunk enables that even further.
5
00:00:33,470 --> 00:00:39,349
To allow higher performance, higher utilization,
and a better research experience.
6
00:00:40,540 --> 00:00:44,590
Sunk was created to deliver the scale that Kubernetes provides,
7
00:00:44,850 --> 00:00:47,880
with the scheduling features that Slurm provides.
8
00:00:48,930 --> 00:00:59,149
CoreWeave Sunk is used on more than 100,000 GPUs across different customers,
allowing for jobs larger than 32,000 GPUs each.
9
00:01:00,280 --> 00:01:04,480
And allows for over 200,000 concurrent jobs all at once.
10
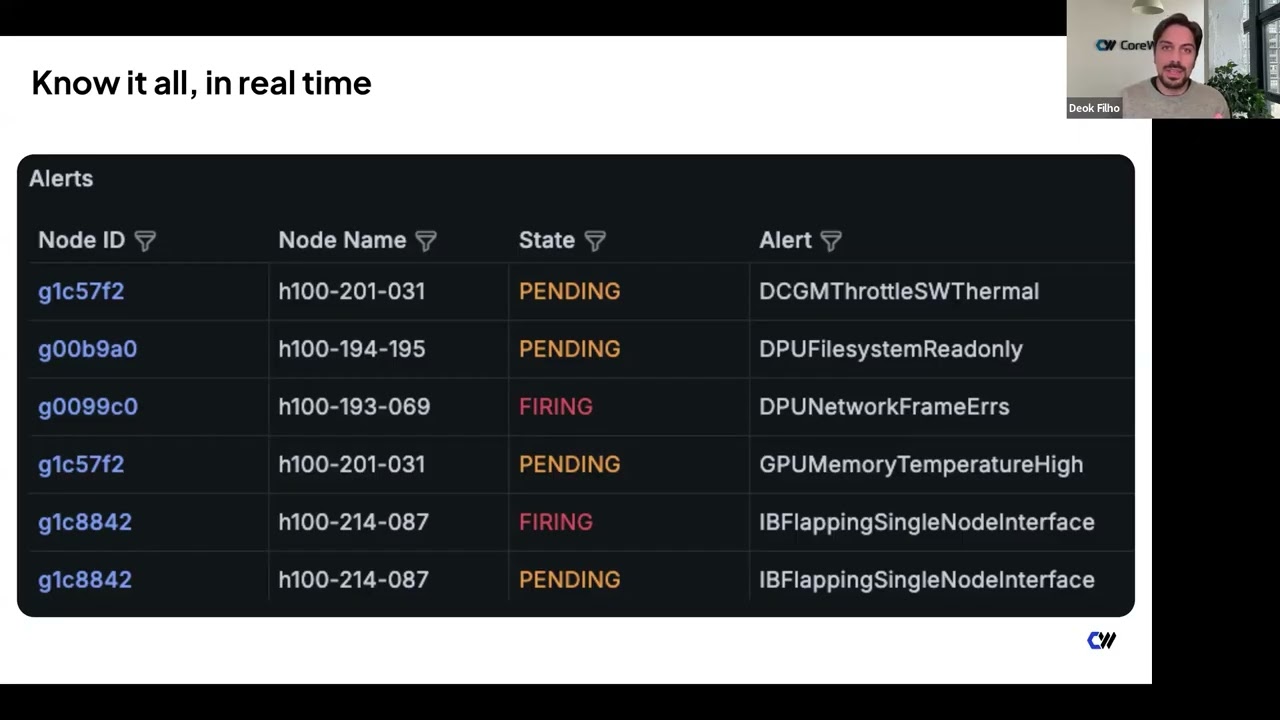
00:01:04,810 --> 00:01:10,309
Sunk has been around for quite some time,
and now we are announcing self-service Sunk.
11
00:01:10,580 --> 00:01:16,009
Which brings onboarding time down from about a week and a half
to around 30 minutes.
12
00:01:16,580 --> 00:01:21,929
And enables an experience that's more focused
on the researcher workflow.
13
00:01:22,130 --> 00:01:25,470
So I'm going to show you what the research experience is like today.
14
00:01:26,200 --> 00:01:31,319
Starting with the CKS cluster, customers can now self-deploy using the UI.
15
00:01:32,130 --> 00:01:43,939
They can specify compute types with GPUs and CPUs,
and get a companion YAML view to deploy through GitOps and continuous deployment.
16
00:01:45,050 --> 00:01:51,329
Customers can easily set up access by selecting groups
17
00:01:51,460 --> 00:01:59,310
and assigning permissions for Slurm users or pseudo-users.
18
00:02:01,450 --> 00:02:06,900
Researchers can access the cluster by uploading their SSH key to the UI,
19
00:02:07,570 --> 00:02:11,489
which is provisioned through Sunk user provisioning.
20
00:02:11,860 --> 00:02:20,350
Within a minute of joining or leaving,
access is granted or removed from a Sunk cluster.
21
00:02:22,040 --> 00:02:30,229
Researchers can quickly view clusters they have access to,
copy the IP, and SSH into their terminal.
22
00:02:31,700 --> 00:02:36,779
Once they have access, they can do what they do best-submit jobs.
23
00:02:39,260 --> 00:02:52,980
Integration between Sunk and Weights & Biases allows customers to gain observability
at both infrastructure and model levels.
24
00:02:53,280 --> 00:03:07,839
Setup is simple: install the library, log in, configure your environment,
and start logging metrics-for example, custom metrics for RL training.
25
00:03:08,690 --> 00:03:12,130
You can view these in the Weights & Biases dashboard.
26
00:03:12,860 --> 00:03:18,029
Customize panels and select the metrics you've logged.
27
00:03:18,500 --> 00:03:33,090
You can also correlate hardware information with job performance,
helping identify node-level issues during troubleshooting.
28
00:03:33,160 --> 00:03:39,139
Quick links take you to detailed infrastructure views.
29
00:03:40,850 --> 00:03:45,819
You can even monitor jobs on the go using the mobile app.
30
00:03:47,310 --> 00:03:56,460
Infrastructure observability is critical for performance and reliability.
31
00:03:56,640 --> 00:04:02,219
CoreWeave provides visibility at the job, cluster, and node levels.
32
00:04:02,560 --> 00:04:09,780
Here we show a job view including state, FLOPs, alerts, and node count.
33
00:04:09,890 --> 00:04:16,139
Detailed GPU metrics include bandwidth, temperature, and power usage.
34
00:04:17,370 --> 00:04:29,350
Overlayed alerts highlight when issues occur,
allowing faster troubleshooting.
35
00:04:29,570 --> 00:04:44,049
With timestamps and alert correlation,
you can quickly identify root causes.
36
00:04:45,270 --> 00:04:52,919
Mission Control provides a curated set of alerts based on real-world experience.
37
00:04:53,300 --> 00:05:03,209
These insights are built from operating large-scale clusters across many customers.
38
00:05:04,610 --> 00:05:17,380
Customers can view resources globally
or drill down into specific jobs or nodes.
39
00:05:19,070 --> 00:05:25,810
Topology-aware scheduling helps ensure jobs are placed efficiently.
40
00:05:25,960 --> 00:05:32,219
You can verify capacity before submitting jobs.
41
00:05:33,390 --> 00:05:43,250
GPU straggler detection identifies slow or stalled GPUs.
42
00:05:43,610 --> 00:05:55,500
It shows which GPU and NCCL function caused the stall.
43
00:05:55,930 --> 00:06:10,030
You can drill into details for faster troubleshooting.
44
00:06:11,280 --> 00:06:26,949
You also get detailed NCCL metrics without stopping your job.
45
00:06:27,150 --> 00:06:42,239
Including bandwidth, latency, sequence number, and message size.
46
00:06:42,530 --> 00:06:53,210
Metrics are broken down by process group size and function type.
47
00:06:54,500 --> 00:06:58,750
To summarize, Sunk has several key differentiators.
48
00:06:59,020 --> 00:07:05,469
User provisioning integrates with identity providers for automation.
49
00:07:05,860 --> 00:07:13,519
Individual login pods give each researcher an isolated environment.
50
00:07:13,740 --> 00:07:27,920
While still allowing easy collaboration via shared storage.
51
00:07:28,980 --> 00:07:36,259
Topology-aware scheduling maximizes performance.
52
00:07:36,380 --> 00:07:46,219
The pod scheduler supports both training and inference workloads.
53
00:07:46,780 --> 00:07:54,510
Pre-built images provide tested, up-to-date environments.
54
00:07:54,640 --> 00:08:02,480
So you can deploy without rebuilding everything yourself.
55
00:08:02,660 --> 00:08:11,669
Deep observability enables higher reliability through Mission Control.
56
00:08:12,940 --> 00:08:17,269
That's all for today. Thank you, and let us know if you have any questions.
